Test Results
After executing a test, all results are stored and available to the user in the test session on the Mobile Money API Compliance Platform.
Session Results
As the tests are carried out, the platform stores the information for each execution in the session history. Thus, the user can access and analyse all the tests run for each test case. In the figure below it is possible to see the main elements present in the session screen when several tests are performed and then, a brief description of these elements is shown.
Session screen elements: 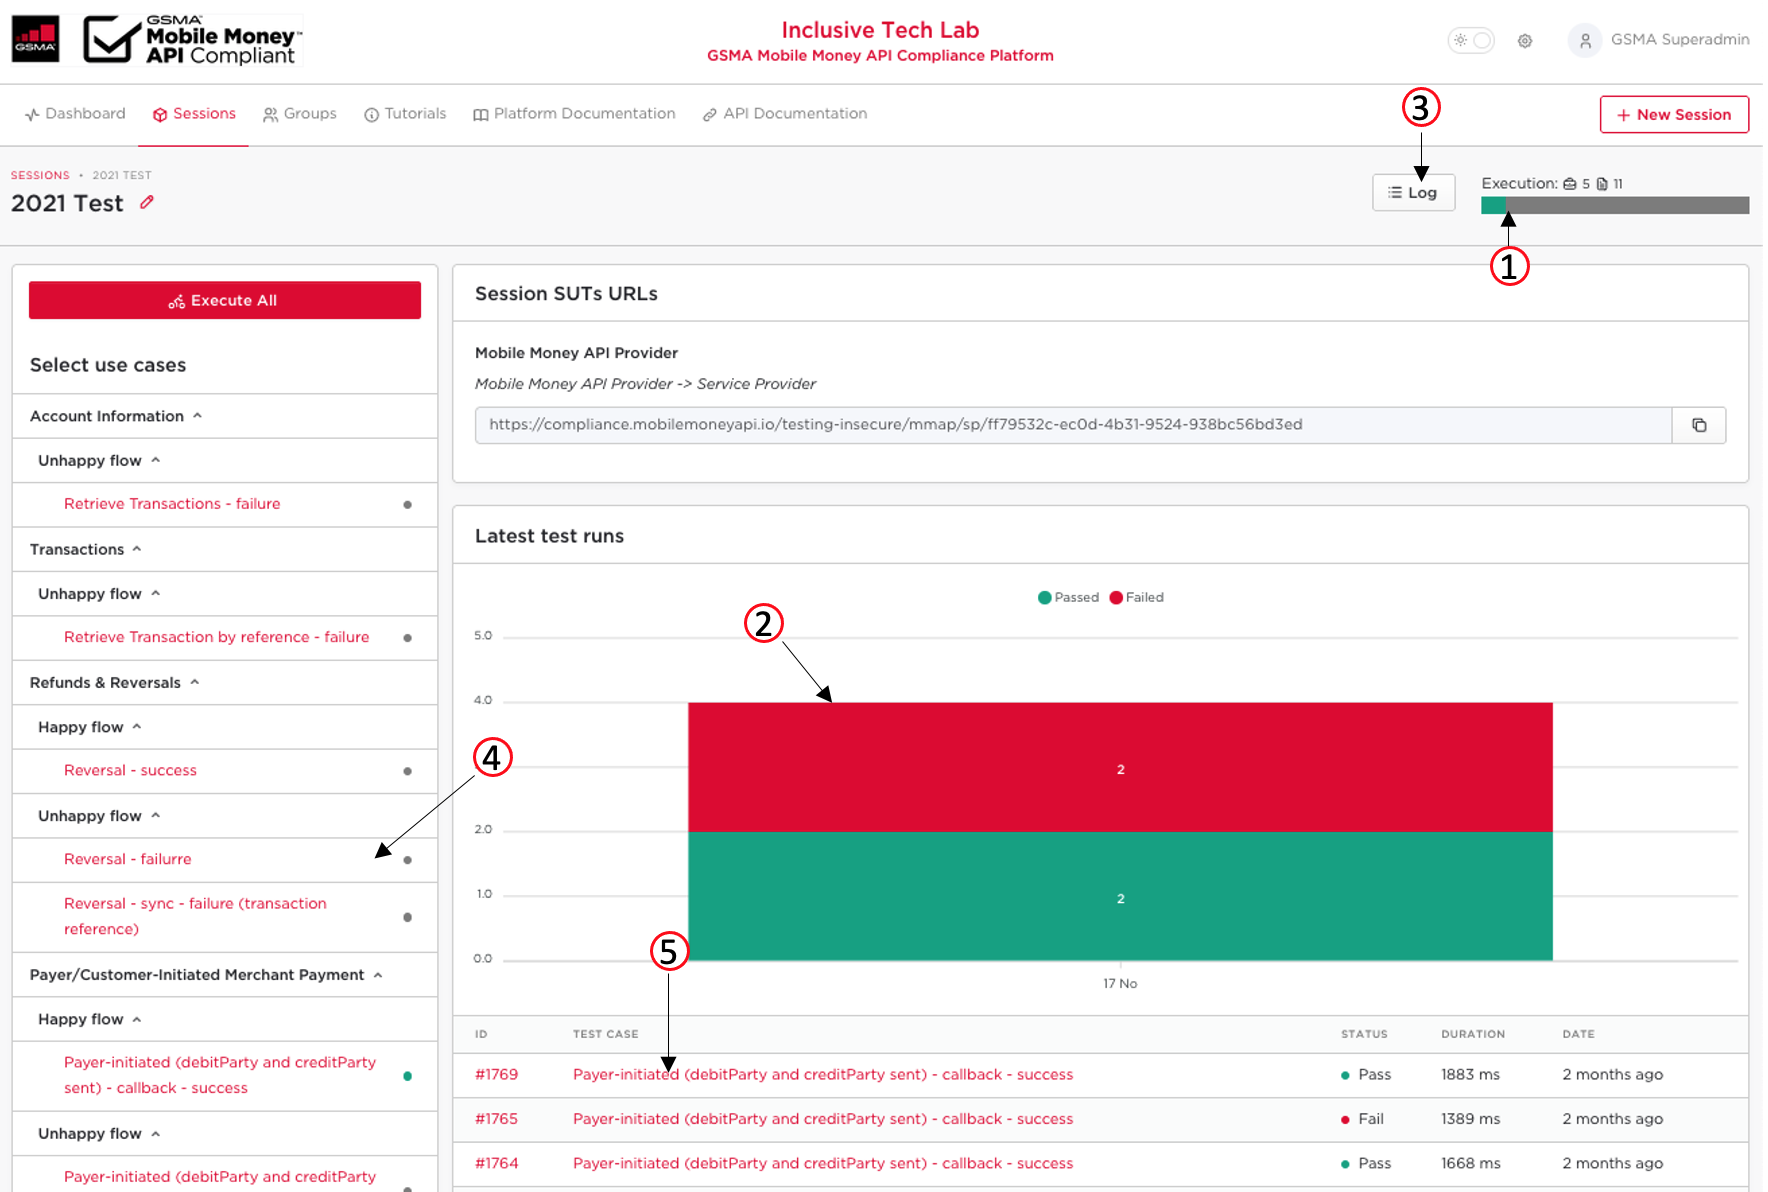
- Summary of the number of passed test cases. Failed tests are shown in red, passed tests in green, and non-executed tests, in grey.
- Information about the recent execution of test cases. The information is grouped by date.
- Link to the session Message Log, where all requests to the platform are recorded. This is often useful in debugging, when a request is not matched with a test case.
- An overview of test cases selected for this session, organized by use case and by happy / unhappy flow.
- In this area, you can view the latest tests run and its information such as:
- Execution ID: Identifier created by the platform to differentiate this execution from the others. For the same test case executed more than once, the platform will assign different Run ID for each execution.
- Test Case Name
- Status: Indicates the state of the test case execution (pass, fail or incomplete)
- Duration: Time in milliseconds that the execution of this test consumed 1.
- Date: Describes when the test was performed.
Accessing Test Case Results
When clicking on a test case, the user will have access to its information and the results of all executions carried out for this particular test. The data that can be seen are principally: configuration, description, preconditions, test runs, test steps and test flow. This information will be further detailed below.
Executions for a test case: 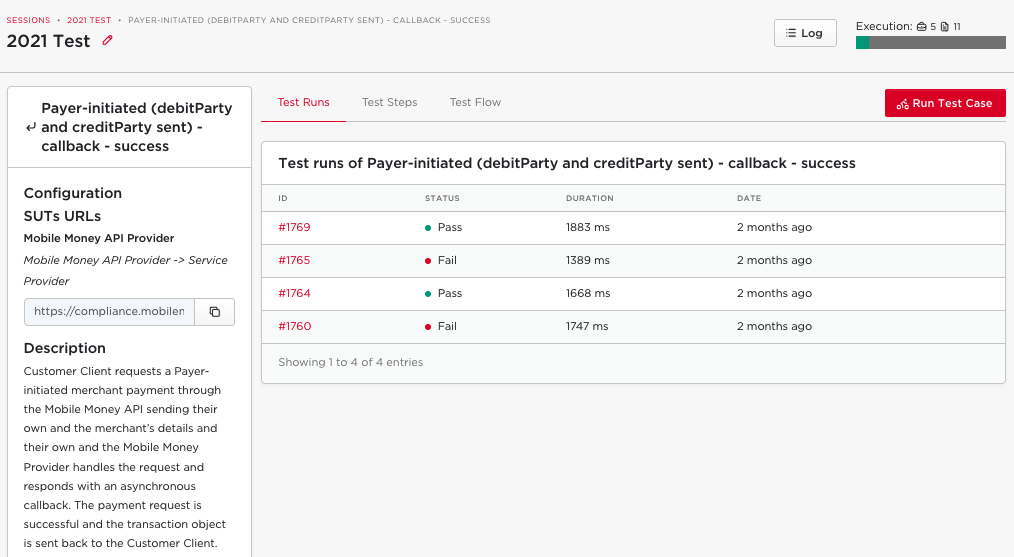
Test Information
Each test case displays its basic information on the left of the screen. Under "configuration," the base URLs are listed for each component addressed by the chosen SUTs. In the figure above, we see the URL that the component called "Client" (which is a SUT in this test session) should use to reach the component called "Server". Underneath, the description contains a general purpose of the test, describing the scenario under simulation. Finally, some test cases describe test preconditions which help in understanding how the tests should be performed. For example, a test case may require a particular "amount" to be set in order to trigger certain behaviour within the simulators.
Test Runs
In the Test Runs tab are all the historic executions of the test case. Each run contains information such as the test run ID, the status, the duration and how long ago the run was performed.
After clicking on a test run ID, the user can navigate through the steps involved in the test case. For each step it is possible to see the overall status, every assertion performed for the test step, and a log of the request and response messages. By clicking on a test assertion, you can see both the details of the request or response as well as the "expected" state when this is different. This information is very useful to understand how the step works and the test case as a whole, especially in the case of unexplained failure in one of the steps.
Information of Test Runs tab: 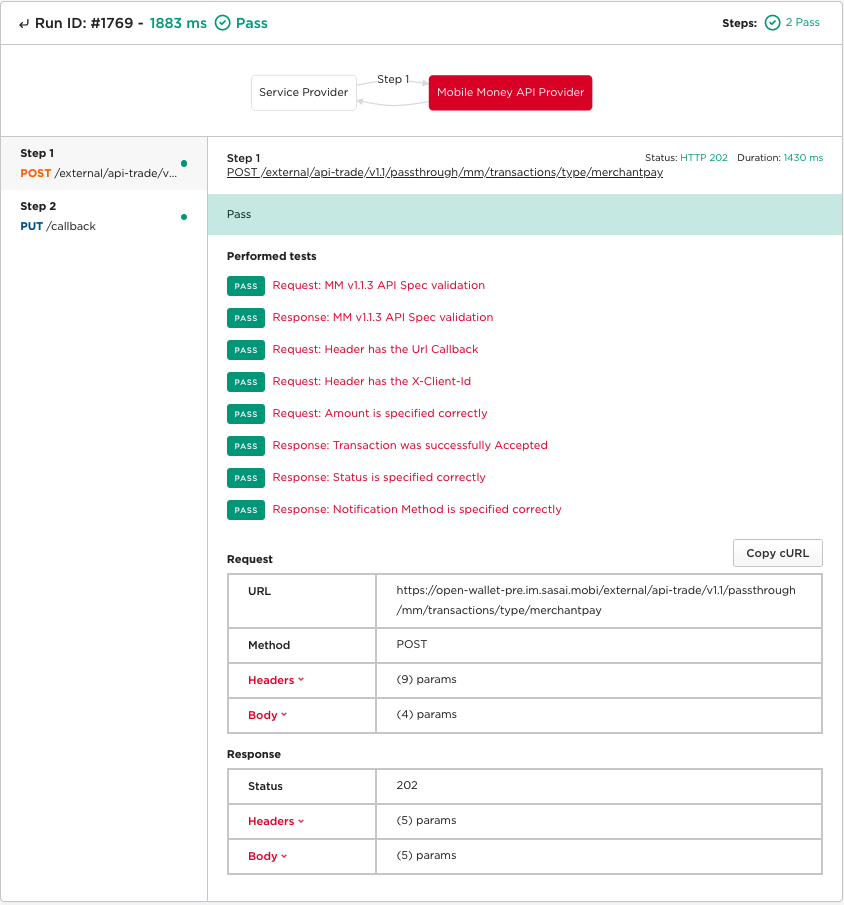
Test Steps
Under the Test Steps tab, it is possible to see a more detailed view of each
of the scripted steps in the test case. In each row of the table you can see the
method used, the endpoint, and the source and destination components for the
request. Clicking on the Request or Response buttons will show an example
request or response, which can be useful in designing your implementation. A
button to copy the request in cURL format is also available, which can be a
convenient way to execute or debug a test case.
Information of Test Steps tab: 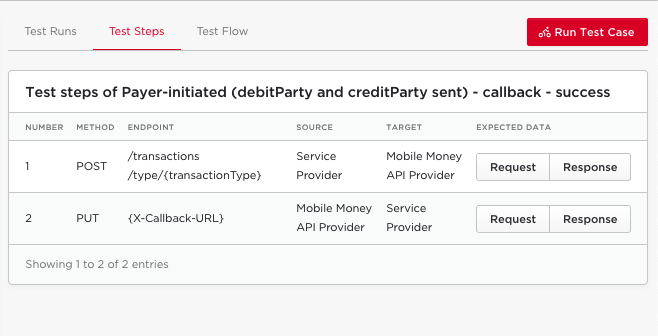
Test Flow
The test flow consists of a sequence diagram showing the messages exchanged between the components involved in the test. Through the flow diagram it is possible to understand how the different components interact over time. This information can also be found in the test steps tab, however the diagram provides a simpler and more directed view of the steps performed, while the steps view provides more detailed information, such as data contained in the header and in the body of the requests.
If the user wishes, the test flow can be exported or edited. By clicking on the Diagram Editor option, the code generated for the test flow is opened on the Mermaid platform. Through Mermaid the user can change the flows, export different types of images and generate the diagram markdown file. This possibility can be a useful tool for creating and viewing new test cases before proposing them to the Mobile Money API Compliance Platform.
Information of Test Flow tab: 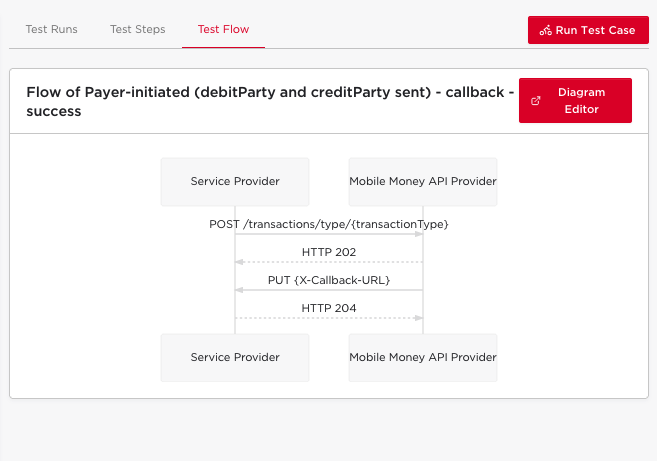
Message Log
The Test Results tab described above lists the execution of every expected
request and response to reach the platform. However it can be the case that
messages do not arrive at the platform in quite the way expected. For example, a
happy test case may expect a message to be sent to the /callback endpoint, but
in reality the SUT sends a message to the /error callback. The same problem
may happen in reverse for an unhappy test case, where an /error request is
expected but a /callback request is sent instead.
These messages will not be displayed in the Test Results tab, because they are not recognised as part of the test case. Instead, they will be displayed in the Message Log view, which is accessible by clicking on the "Log" button in the top right.
On this page, every request which reached the platform is displayed. Where a test case is identified for the request, the matching test step is included. Where a test case is not identified, the request details are nonetheless displayed for debugging purposes, along with any error messages that were generated by the platform on receipt.
Message log: 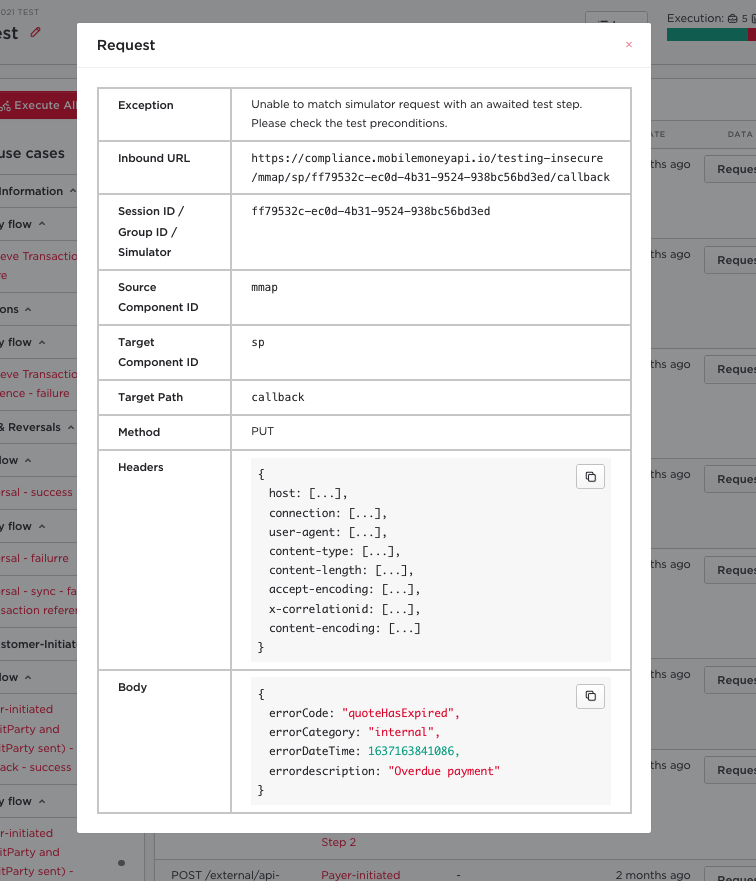
Footnotes
- 1: This duration is directly related to the GSMA Mobile Money API Compliance Platform. The performance of the system under test is not evaluated here, since part of the test execution comes from simulated components, which may involve artificial simulated delays.